Metrics Overview
Visualize your system and application metrics for better decisions.
Metrics provide objective insight into system behavior by capturing trends over time. Infrastructure indicators such as CPU, memory, and disk usage help identify capacity constraints, while application metrics expose performance bottlenecks and user-impacting issues.
In mature DevOps practices, these measurements are continuously reviewed to support proactive optimization, incident response, and long-term planning across environments.
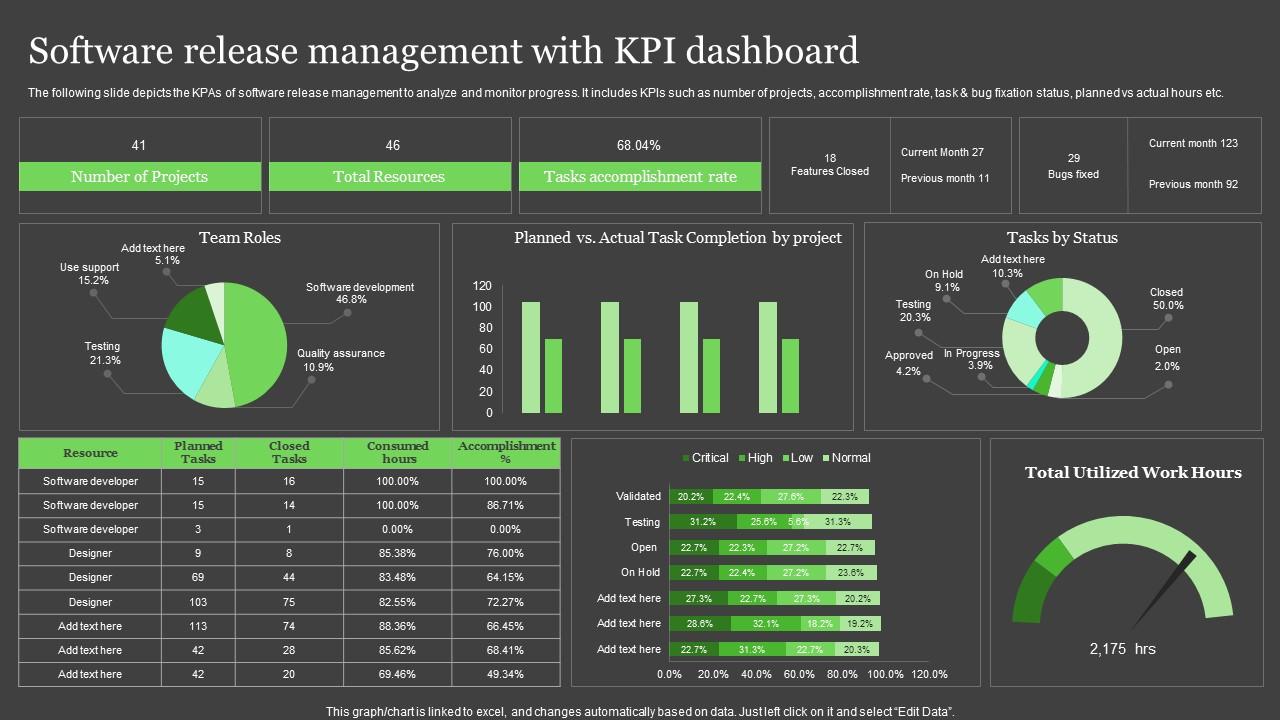
Key performance indicators (KPIs) summarize the most important operational signals in a compact format. Defined thresholds help teams quickly identify abnormal conditions before they escalate into production incidents.
| Metric | Current Value | Threshold |
|---|---|---|
| CPU Usage | 45% | 80% |
| Memory Usage | 3.2 GB | 8 GB |
| Disk Space | 120 GB Free | 50 GB Free |
Operational Metrics Overview
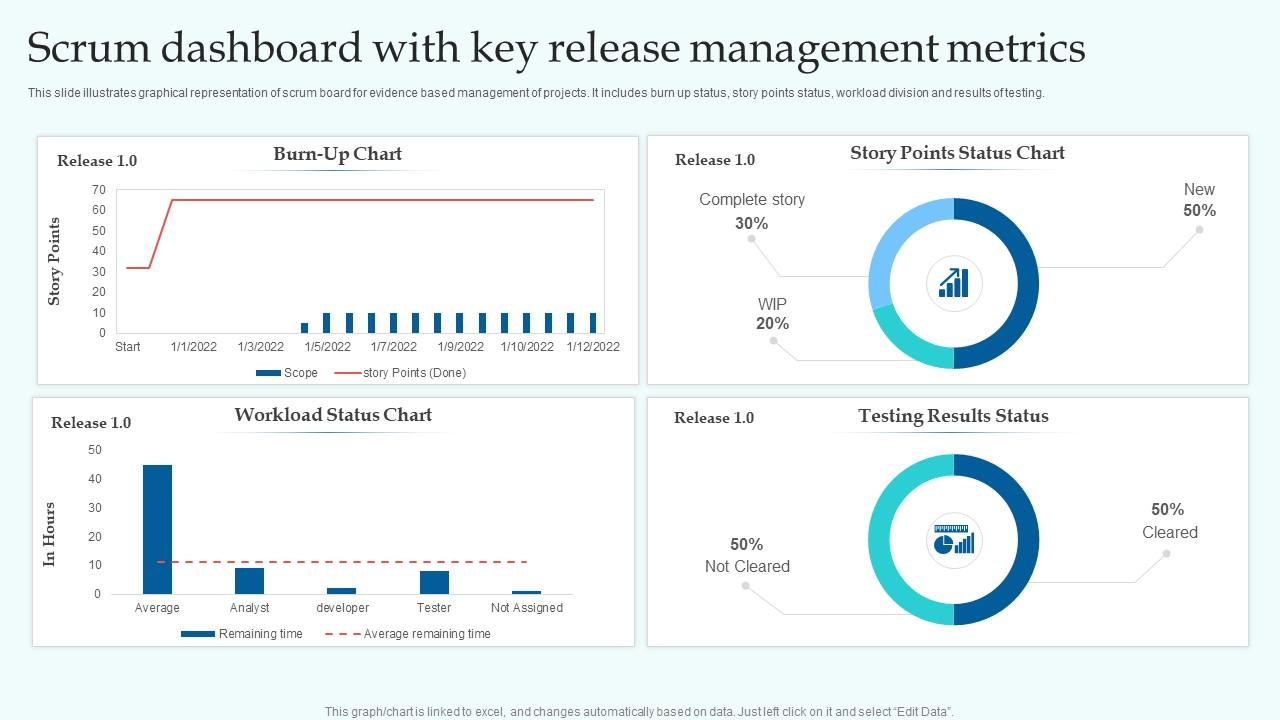
Operational metrics provide visibility into platform stability, delivery efficiency, and overall system health.
These metrics are widely referenced in DevOps and SRE frameworks to measure deployment confidence, failure rates, and recovery capabilities during service disruptions.
Deployment Frequency
How often releases are deployed.
Change Failure Rate
Percentage of deployments causing incidents.
Mean Time to Recovery
Average time to restore service after failures.
Lightweight Automation & Build Logs
GitHub-triggered automation for builds and logs — simple, reliable, Jenkins-free.
⚡ How It Works
-
Clone / Sync Repository
git clone https://github.com/loganathr20/Lightweight-Automation.git -
Open Trigger File
Trigger_SITBuild.txt - Enable Trigger (set trigger=true)
- Commit Changes
- Cron Triggers Build
- Logs Delivered