Application Health Monitoring Overview
Application health monitoring is a critical DevOps practice focused on ensuring that applications remain available, responsive, and reliable in production environments. Unlike infrastructure monitoring, application monitoring focuses on user-facing behavior and service-level health.
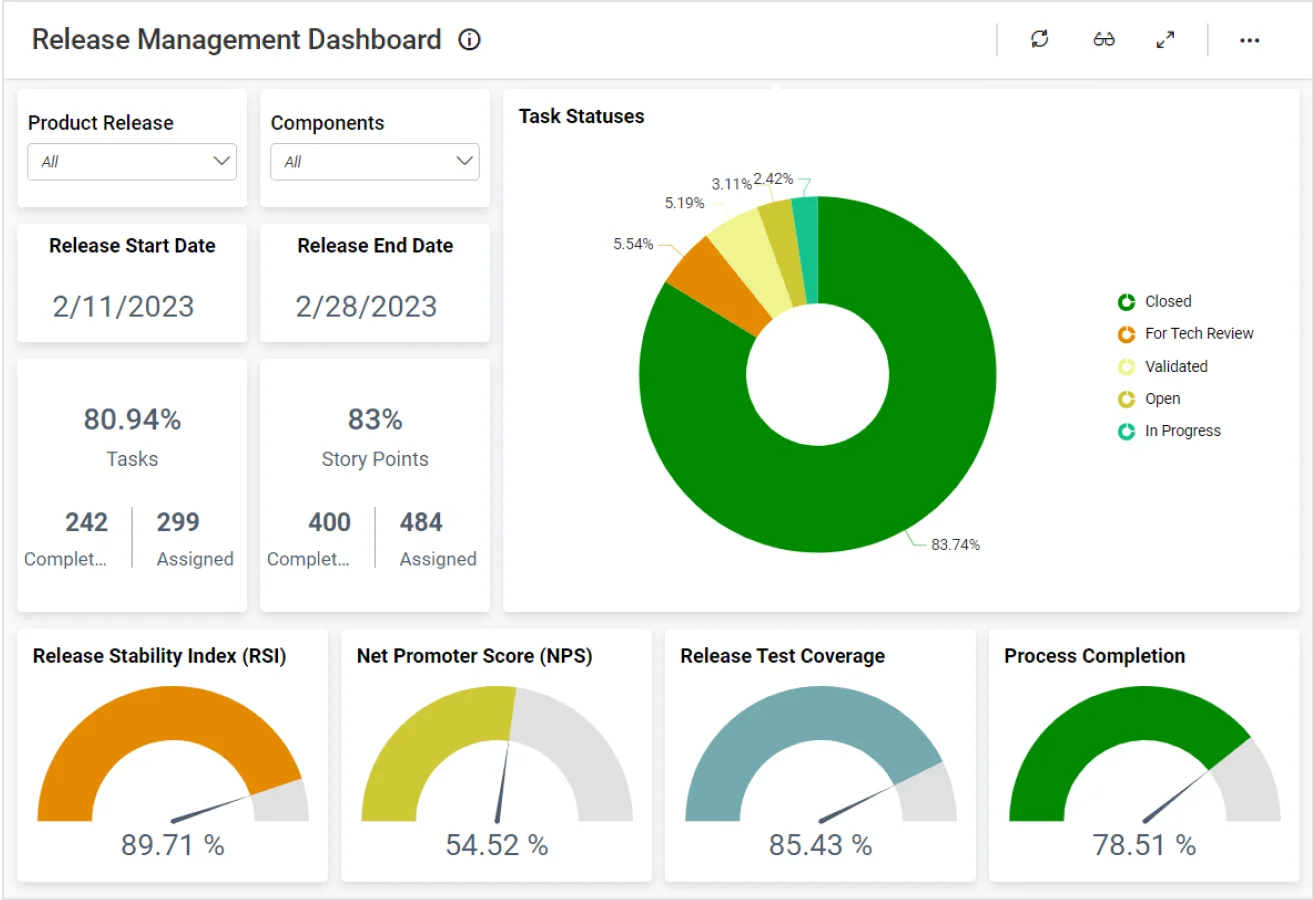
This page presents a sample application healthcheck dashboard used for educational purposes on the EZDevOps ThinkCentre platform. The metrics and charts shown here reflect real-world monitoring patterns commonly implemented in production DevOps systems.
What Is Monitored
- Application uptime and availability
- Response time and latency
- Service health and dependencies
- Error rates and log patterns
- Operational stability over time
Why This Matters in DevOps
In CI/CD-driven environments, frequent deployments can introduce risk. Continuous application monitoring ensures that deployments do not negatively impact system health and user experience.
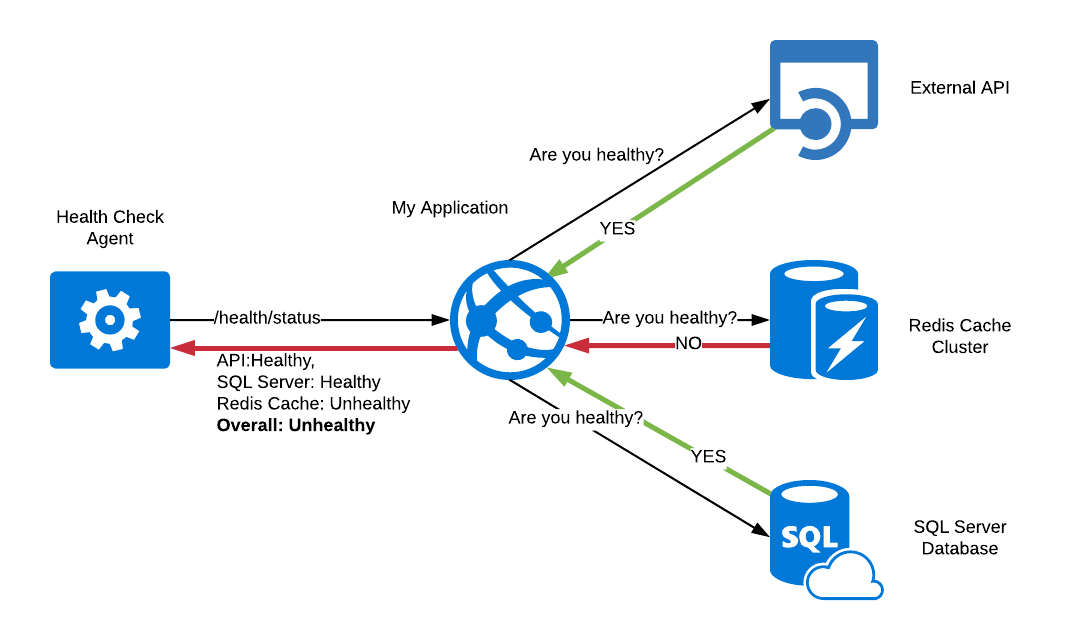
Application HealthCheck
Track application performance and detect errors early.
Sample Application Health Dashboard
The charts below demonstrate how application metrics are visualized for Linux servers hosting the EZDevOps platform. These dashboards help DevOps teams identify anomalies, troubleshoot incidents, and maintain service reliability.
Uptime Monitoring
Track uptime percentage of critical applications.
Response Time
Monitor average response times.
Service Status
Active vs inactive services.
Log Analysis
Error and event tracking.